Click to experience
icon of hand clicking
tab background

Customer
Story

Industrial cutter for grinding meat in a processing plant.
icon of hand clicking
icon of down arrow
icon of meter with needle

Smart.

SENSORS

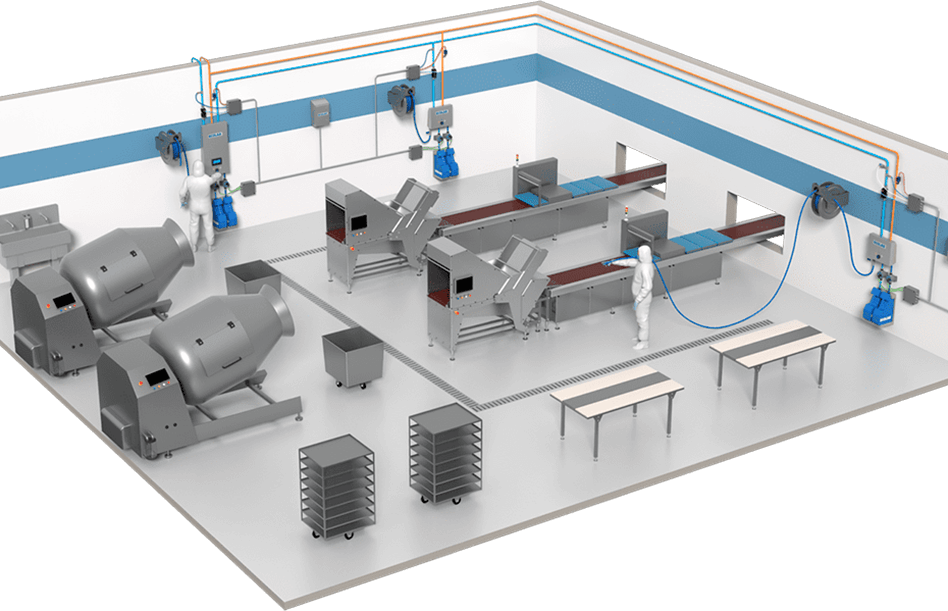
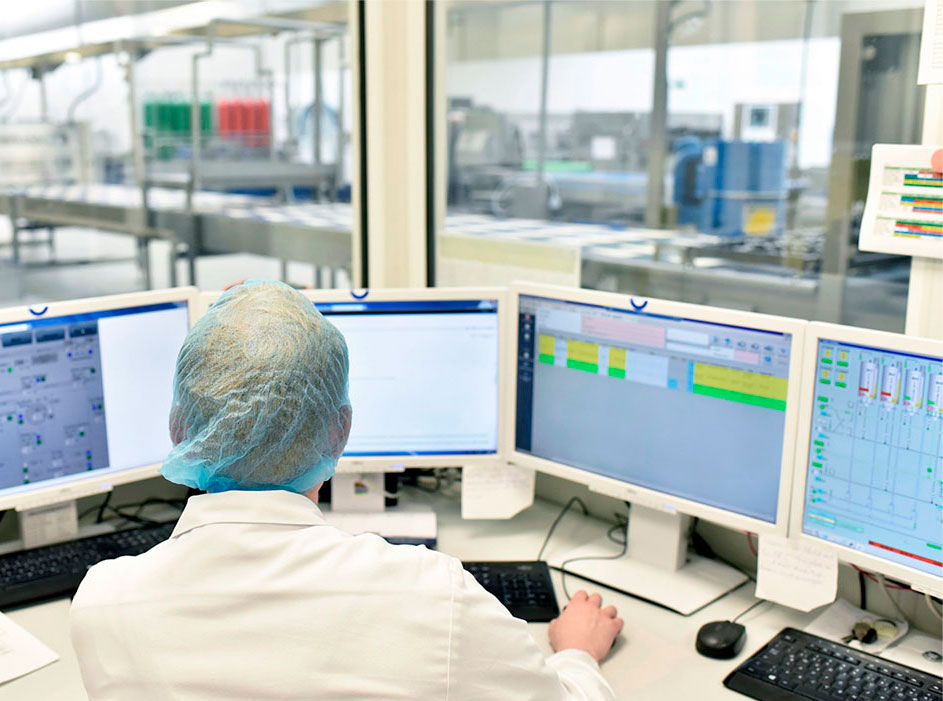
The customer decided to implement Manual Cleaning Insights (MCI) because they wanted to better monitor and manage their cleaning, sanitizing and disinfection processes.

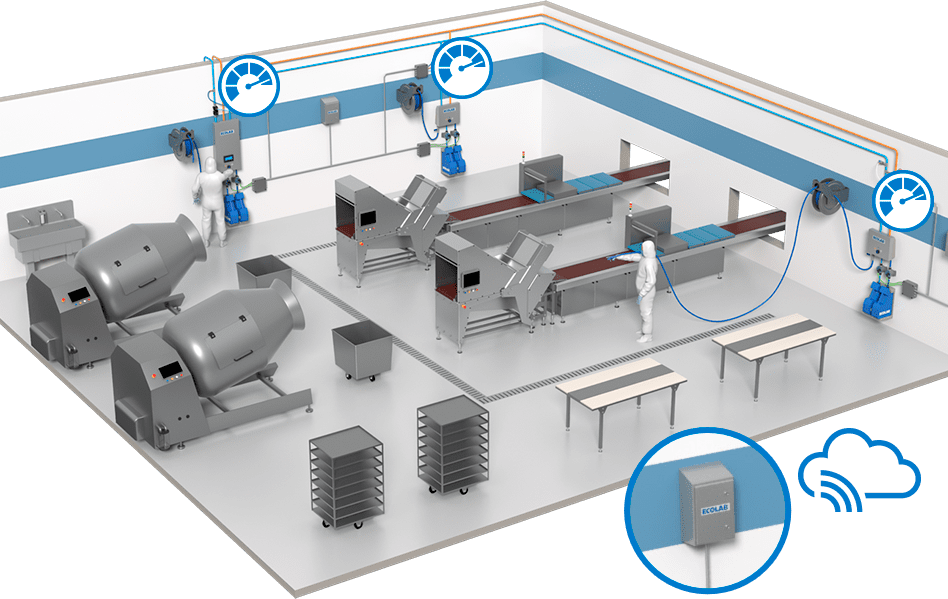
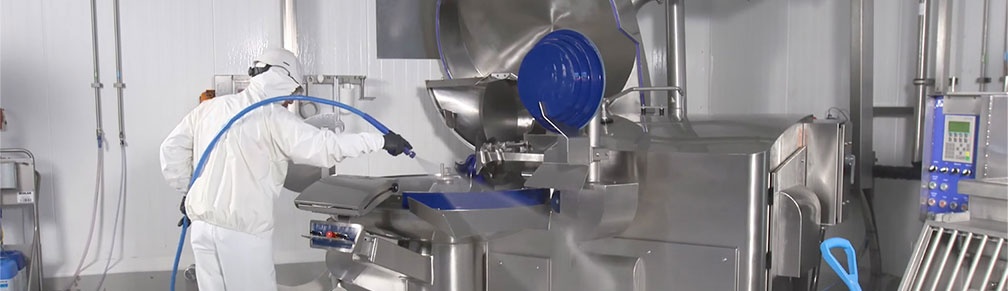
Sensors and Ecolab controllers were installed on cleaning stations to start capturing critical parameters (e.g. water flow, chemistry concentration) and set limits around them.

Isometric view of workers manually cleaning a room in a
                  meat processing plant Isometric view of workers manually cleaning a room in a
                  meat processing plant
icon of down arrow
icon of thought bubble for Clear

Clear.

EMAIL ALERTS

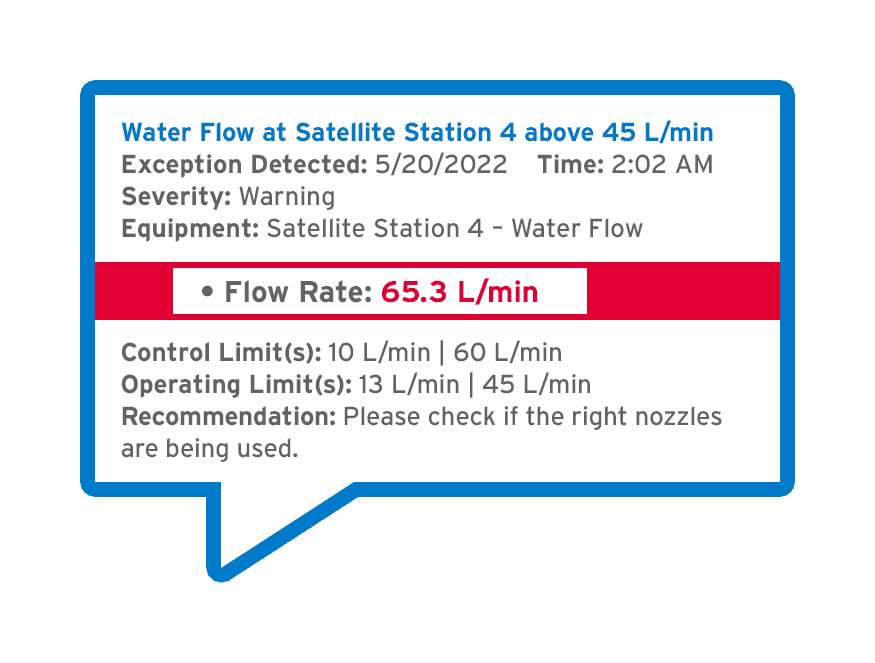
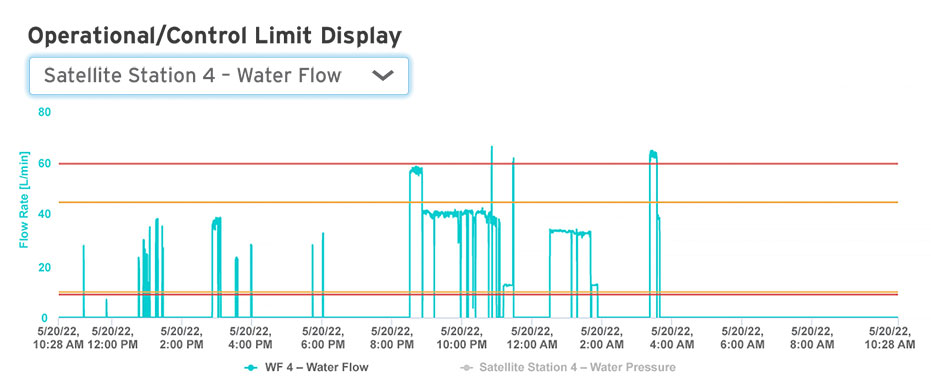
Soon after the sensors were installed and configured, the customer received email alerts notifying them water flow rates were exceeding the set limit of 45 L/min — often reaching 60 L/min or above.

A technician oversees multiple computer screens
                  in the control room of a processing plant
Water Flow at Satellite Station 4 above 45 L/min | Exception Detected: 5/20/2022 Time: 2:02 AM Severity: Warning | Equipment: Satellite Station 4 – Water Flow | Actual Value(s): • Flow Rate: 65.3 L/min | Control Limit(s): 10 L/min | 60 L/min Operating Limit(s): 13 L/min | 45 L/min | Recommendation: Please check if the right nozzles are being used.
icon of down arrow
icon of computer with graph

Clear.

MCI DASHBOARD

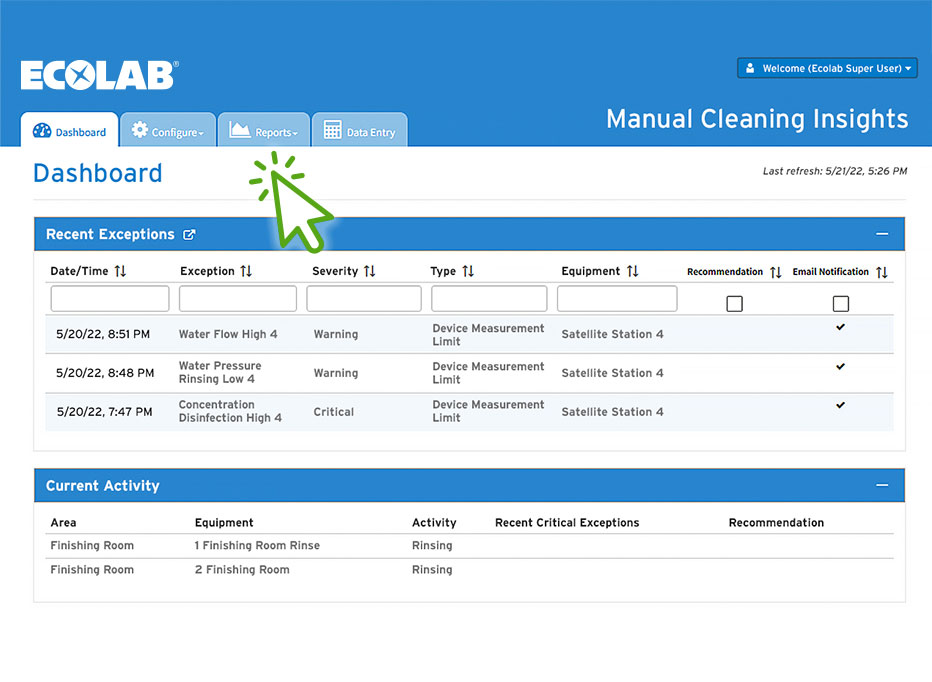
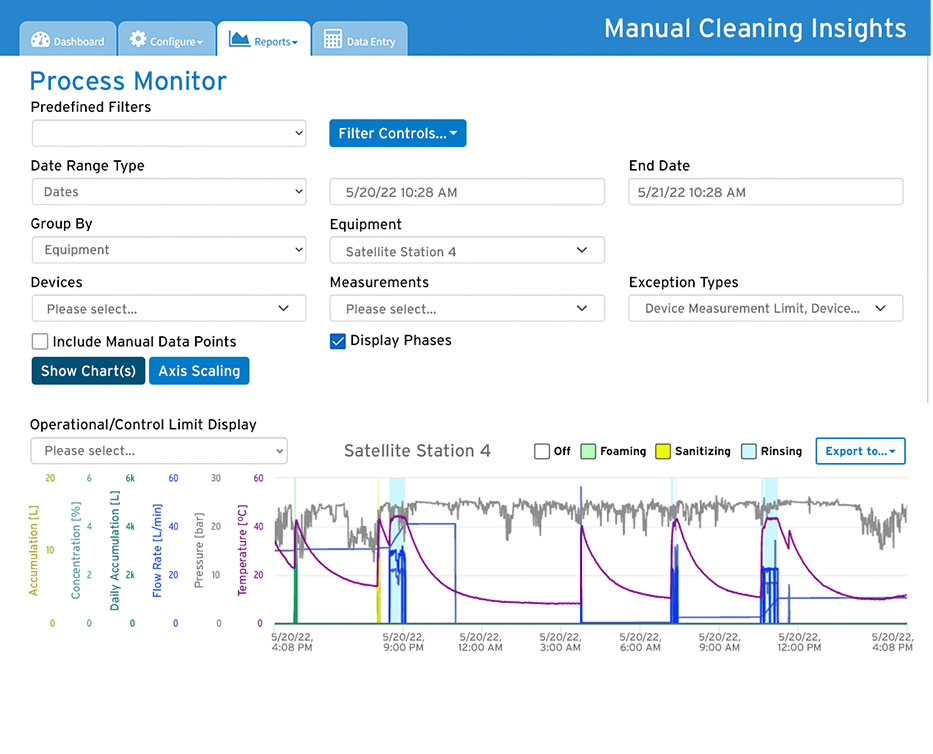
To better understand why and how often these fluctuations were happening, the customer’s sanitation supervisor went to the MCI dashboard.

Ecolab Manual Cleaning Insights dashboard
                      screen with arrow pointing to Reports tab
icon of computer with graph

Clear.

MCI DASHBOARD Sorting through data

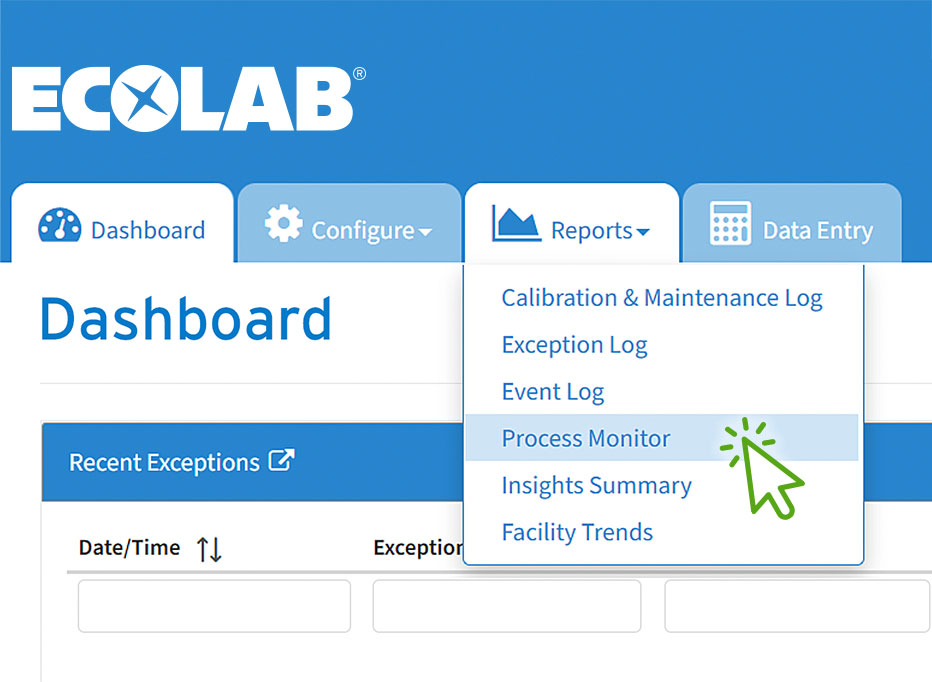
By going into the Process Monitor, they were able to quickly filter the search results by the specific time period and equipment.

Close up view of Ecolab Manual Cleaning Insights dashboard screen with drop down menu opened and Process Monitor highlighted
icon of computer with graph

Clear.

MCI DASHBOARD Troubleshooting issues

After applying filters, they were able to dive into the details and visualizations to identify the root cause of the issue.

Ecolab Manual Cleaning Insights Process Monitor screen
icon of down arrow
Icon of piece of paper

Connected.

ACTION

After further investigation, the sanitation supervisor confirmed the operators were manipulating the rinsing nozzles — or not using them at all, which led to a higher and unnecessary consumption of water and energy.

Ecolab recommended the optimal rinsing nozzles and the customer trained their operators on their correct usage.

Worker rinsing an industrial cutter in a meat plant Operational/Control Limit Display Chart
icon of down arrow
Icon of piece of paper

Connected.

ACTION

By acting on the alerts and recommendations provided by MCI, the customer reduced their hot water usage during manual cleaning by

25%
Icon of a down arrow and water drop
Isometric view of a meat processing plant, showing workers manually cleaning conveyor belts, cutting tables and mixing drums
icon of checkmark